Shapely example: Where to build cell-towers?
Posted on 2024-01-27, by Racum.
This is a fun example of how to use Shapely to solve geographical problems. On this article I show how to cover a polygon with circles in a hexagonal pattern.
Disclosure: I know quite well that this example is not realistic: real cell-towers are positioned according to terrain, urban density, zoning laws, etc. They are not played out on a nice regular grid. But, please indulge me for the sake of this exercise.
Hexagon math
All the internal angles of a regular hexagon have 120°, and, if you draw a hexagon with their top and bottom lines aligned with the X axis, the other sides will have an angle of 60° in relation with the Y axis. To position a point follow a circle path, you need to get the sine and cosine of the angle, in this case sin(60) and cos(60). After this, is just a matter of distributing the points according with the offsets.
Run this snippet of code on Jupyter Notebook:
from math import sin, cos, radians
from shapely.geometry import Point, MultiPoint
from shapely.plotting import plot_polygon, plot_points
import matplotlib.pyplot as plt

xo = cos(radians(60)) + 1    # X offset
yo = sin(radians(60)) * 2    # Y offset
points = [
    Point(0, 0),             # Center
    Point(0, yo),            # North
    Point(xo, yo / 2),       # Northeast
    Point(xo, -yo / 2),      # Southeast
    Point(0, -yo),           # South
    Point(-xo, -yo / 2),     # Southwest
    Point(-xo, yo / 2),      # Northwest
]

plot_points(MultiPoint(points))
for point in points:
    plot_polygon(point.buffer(1), add_points=False)
plt.show()
You should see a plot like this:
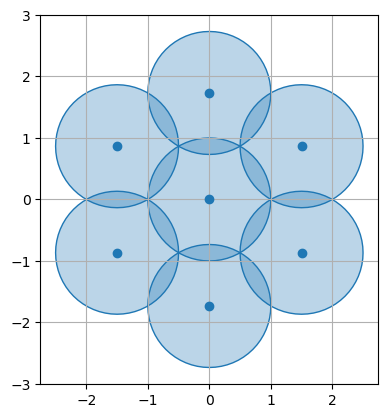
Python’s sin() and cos() work with radians, not degrees, hence the radian() function to convert them.
Covering a polygon with hexagons
Based on what we learned from the snippet above, here is a function that returns the cells needed to cover a polygon:
from dataclasses import dataclass
from math import sin, cos, radians, ceil
from shapely.geometry import Point, Polygon

@dataclass
class Cell:
    center: Point
    coverage: Polygon

def cover_hexagon_grid(polygon: Polygon, radius: float) -> list[Cell]:
    min_x, min_y, max_x, max_y = polygon.bounds
    xo = radius * (1 + cos(radians(60)))  # X offset
    yo = radius * sin(radians(60)) * 2  # Y offset
    row_even_col = [yo * i for i in range(ceil((min_y - yo) / yo), ceil((max_y + yo) / yo))]
    row_odd_col = [(yo / 2) + (yo * i) for i in range(ceil(min_y / yo) - 1, ceil(max_y / yo))]
    cells = []
    for column in range(ceil((min_x - xo) / xo), ceil((max_x + xo) / xo)):
        row = row_odd_col if column % 2 else row_even_col
        for point in [Point(column * xo, r) for r in row]:
            coverage = point.buffer(radius)
            if coverage.intersects(polygon):
                cells.append(Cell(center=point, coverage=coverage))
    return cells
Explanation:
- The class
Cellholds a pair of center and coverage, the function returns a list of this object. - The first thing we do is to get the “bounds” of the polygon, even if the polygon has an irregular shape, the
.boundsreturns a simple rectangle. - Then, we calculate the offsets, this is basically the same application of
sin(60)andcos(60), but multiplied by the radius of the upcoming circles. - With the offsets at hand, we calculate the position of the rows, and since they alternate, I calculate both even and odd cases to select later.
- The first loop iterates over the column indexes, that look something like this:
[-2, -1, 0, 1, 2]. - Inside the column loop, we get the proper row (even or odd) and iterate over it
- Now with the column and row positions, we iterate over all of them, but only add to
cellsthe ones where the circle around the point (.buffer(radius)) intersects with the original polygon - Return the intersecting cells.
Here is another Jupyter Notebook snippet, with the function cover_hexagon_grid() in use:
from shapely.geometry import Point
from shapely.plotting import plot_points, plot_polygon
import matplotlib.pyplot as plt
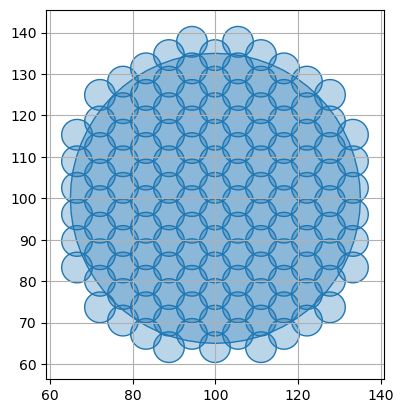
polygon = Point(100, 100).buffer(35)
cells = cover_hexagon_grid(polygon, 3.7)
plot_polygon(polygon, add_points=False)
for cell in cells:
plot_polygon(cell.coverage, add_points=False)
plt.show()
It should look like this:
Working with coordinates and GeoJSON
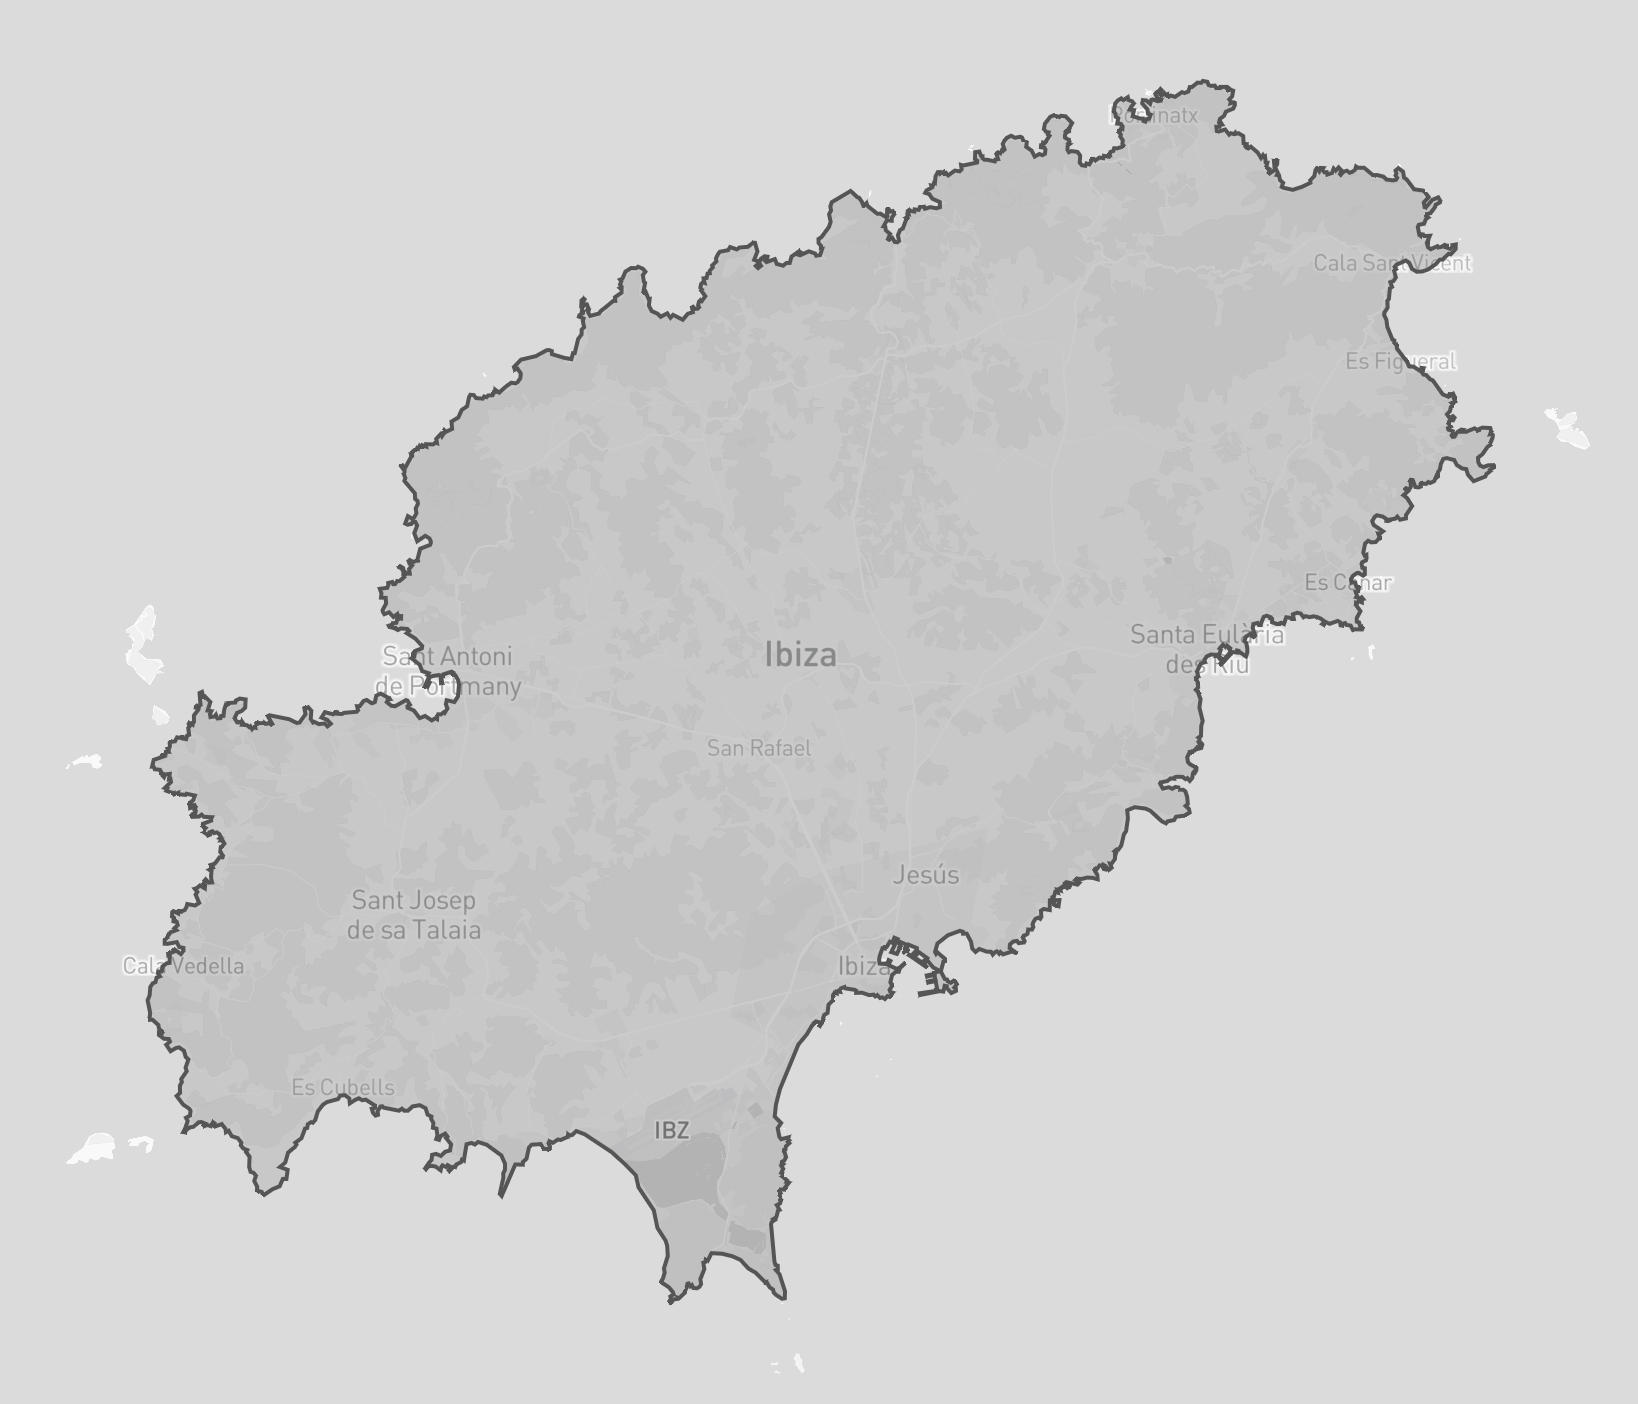
Ok, now that we have a good function, let’s put it to use on a real geometry! I got a GeoJSON file for the island of Ibiza from OSM (see my other article OpenStreetMap to GeoJSON), and here is how it looks like:
The coordinates from GeoJSON are geodesic (as in longitude/latitude), but Shapely operates on a cartesian plane, if you try to apply the function above direct on it, everything will be very deformed due to projection mismatch. You need to convert to cartesian first, apply the function and convert the output back to geodesic. Thankfully I also wrote an article about this: Converting projections on Shapely.
Copy the content of the function get_projections() from the other article before running this:
import json
from shapely.geometry import MultiPoint, MultiPolygon, shape, mapping

with open('ibiza.geojson', 'r') as geojson:
    ibiza = shape(json.load(geojson))

# See https://racum.blog/articles/projection-shapely/#conversion-functions
geodesic_to_cartesian, cartesian_to_geodesic = get_projections(ibiza.centroid)

cells = [
    Cell(
        center=cartesian_to_geodesic(c.center),
        coverage=cartesian_to_geodesic(c.coverage)
    ) for c in cover_hexagon_grid(geodesic_to_cartesian(ibiza), 1500)
]

with open('ibiza_towers.geojson', 'w') as geojson:
    json.dump(mapping(MultiPoint([c.center for c in cells])), geojson)

with open('ibiza_coverages.geojson', 'w') as geojson:
    json.dump(mapping(MultiPolygon([c.coverage for c in cells])), geojson)
This will create 2 GeoJSON files containing the towers and the coverages. I’m setting a radius of 1.5Km per tower on this example, it means the coverages will be circles with 3Km of diameter, intersecting with their neighbors, and with no gaps.
Here are the towers:

…and the coverages:

Conclusion
Again, this is not about cell-towers! this article is here to give you ideas on how to use Shapely to solve your geographical problems. Feel free to play with the examples, like using your own city, or changing the radius of the circles.
I also strongly recommend you try this on Jupyter Notebook, the functions from shapely.plotting look very nice on it.